Most businesses keep storage and distribution separate. One team runs the warehouse, another handles shipping, and that gap is usually where orders get delayed and costs go up. In reality, they are one system. When they work together, goods move faster, inventory stays accurate, and fulfillment costs drop.
Every product follows a clear path from the receiving dock to the delivery truck. Each step has a trigger, a formula, and a handoff that either works or fails. At Logos Logistics Distribution in Ontario, CA, we connect these two functions every day for businesses that are ready to run a tighter, more predictable supply chain.
What Storage and Distribution Actually Mean, and Why They’re Not the Same Thing
Storage holds inventory until it’s needed. Distribution moves it out once a trigger says it’s needed. They’re sequential stages of the same flow, and the trigger between them is the single most important concept.
What Does Storage Actually Do in a Supply Chain?
Storage absorbs the timing gap between when goods arrive and when demand shows up. A pallet does not move the instant it is unloaded. It sits, organized and tracked, until an order, schedule, or forecast says it is time.
Storage has three jobs: protect the goods, keep an accurate count, and keep inventory organized for fast retrieval. Done well, it is invisible. Done poorly, the problems show up downstream as stockouts, wrong shipments, or slow picking.
How Does Distribution Get Inventory to the Right Place on Time?
Distribution gets stored inventory to its next destination, whether a retail shelf, a 3PL dock, or a customer’s door, accurately and on schedule. It covers order processing, picking, packing, carrier selection, and last-mile delivery.
Storage rewards organization and patience. Distribution rewards speed and coordination. Most operational problems happen exactly where these two skill sets meet.
Why Do Most Warehouse Problems Start at the Handoff Between the Two?
Storage keeps goods safe, counted, and organized until demand calls for them. Distribution takes over the moment that call comes in. When the handoff between the two breaks down, the cost does not stay contained. It spreads into late shipments, wrong orders, and inventory that no one can account for.
The Actual Process: How a Product Moves From Storage to the Customer
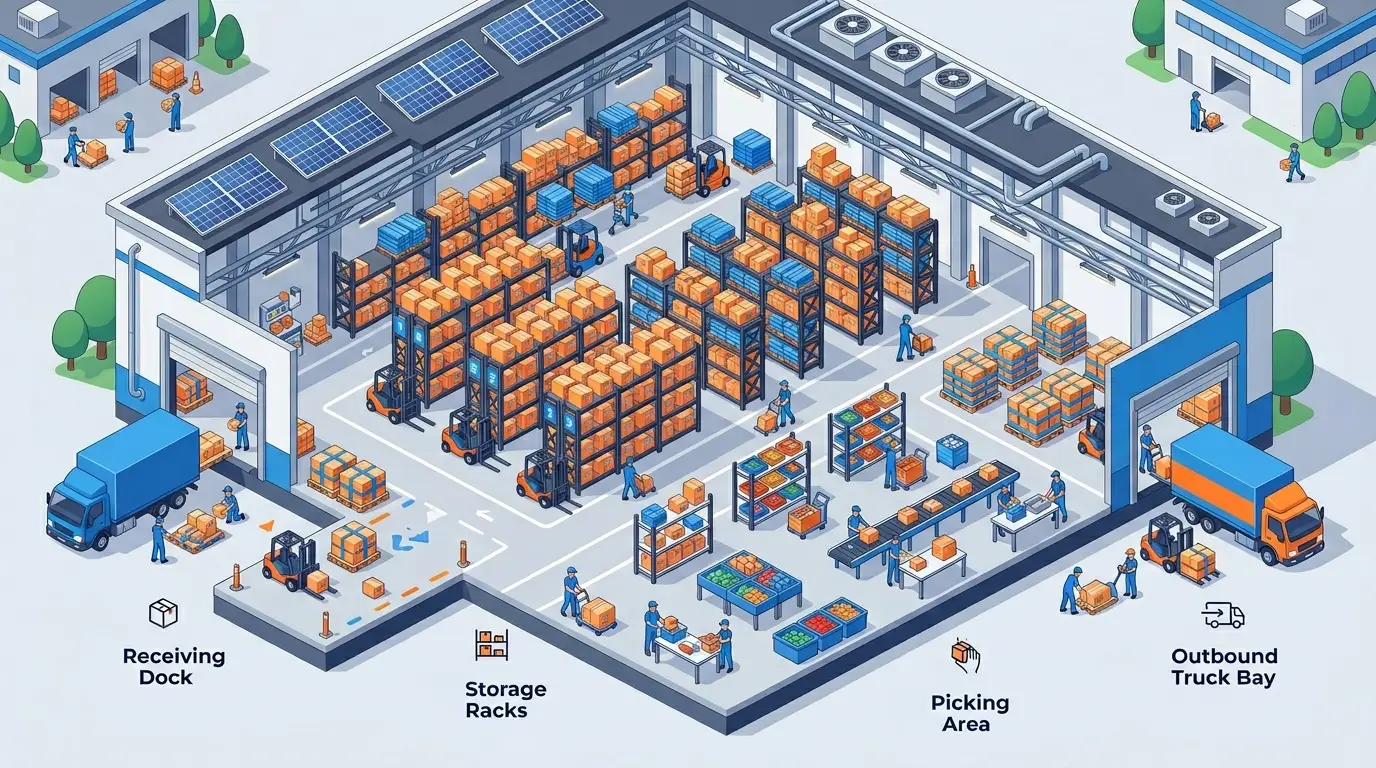
A unit of inventory moves through five connected stages: receiving and put-away, storage and slotting, a replenishment trigger, picking and packing, and outbound delivery. A failure in stage one doesn’t stay contained; it surfaces stages later as a picking error or a late shipment.
Step 1: Inbound Receiving and Put-Away
Receiving checks a shipment against its purchase order, inspects it for damage, and logs it into inventory records, usually via barcode or RFID scan. Put-away moves that inventory from the dock to its assigned storage location.
Where a SKU gets put away already depends on how fast it’s expected to move. A fast seller stored in a slow-to-reach bulk location adds travel time to every pick later on.
Step 2: Storage and Slotting
Storage isn’t passive shelf space. It’s an active decision about where each SKU lives based on how often it gets picked: fast movers close to packing and shipping, slow movers further away.
While inventory sits, it’s tracked continuously (perpetual inventory) or counted periodically (periodic inventory), and that distinction decides how fast a warehouse notices when stock needs replenishing.
Step 3: The Replenishment Trigger
This is the moment storage becomes distribution: the reorder point, a calculated level where on-hand inventory is low enough that a new order has to start.
Without a defined trigger, “storage and distribution working together” is just two functions sharing a building. With one, every SKU has a calculated answer for when it starts moving toward the customer.
Step 4: Picking and Packing
An order gets released, whether by a customer purchase, a replenishment order, or a forecast-driven push. Pickers retrieve the SKUs and quantities needed, and packing consolidates them into a shippable unit.
Order picking accounts for up to 55% of warehouse operating costs, with over half of picking time spent on travel rather than the pick itself. That’s why storage layout is a direct lever on distribution cost.
Step 5: Outbound and Last-Mile Delivery
The final stage puts the packed order on the right carrier toward its destination, whether an LTL shipment to a retail DC or a last-mile delivery to a home. A transportation management system typically handles this stage alongside the WMS.
This step also resets the loop. The outbound shipment lowers on-hand inventory, moving the SKU closer to its next reorder point. Storage and distribution repeat this cycle continuously for every SKU.
Inbound vs. Outbound Logistics: Where Storage Ends and Distribution Begins
Inbound logistics covers receiving, inspection, and put-away. Outbound logistics covers picking, packing, and shipping. Storage lives on the inbound side; distribution lives on the outbound side.
| Inbound Logistics | Outbound Logistics | |
| Primary function | Receiving and storing goods | Fulfilling and shipping orders |
| Key activities | Receiving, inspection, put-away | Picking, packing, carrier dispatch |
| Primary system | WMS | TMS |
| Main cost driver | Labor for unloading and put-away accuracy | Labor for picking plus freight cost |
| Failure mode | Receiving errors, misplacement | Late shipments, wrong-item errors |
Both sides share the same inventory record. A receiving error rarely stays an inbound problem; it tends to surface days later as an outbound stockout.
Storage Strategy: How Warehouses Decide What Goes Where
Storage strategy determines where each SKU sits, based on pick frequency, handling needs, and expected dwell time. Get it wrong, and distribution inherits the cost as slower, pricier fulfillment.
Bulk Storage vs. Pick Storage
Bulk storage holds large quantities in dense, less accessible spots. Pick storage holds smaller, replenished quantities in fast, easy-to-reach spots near packing. Most warehouses run both for the same SKU, with a bulk reserve feeding a smaller pick face.
Slotting Strategy and ABC Inventory Analysis
Slotting assigns each SKU a location based on pick frequency, size, and handling requirements. ABC analysis is the standard framework:
- A items, the top 10 to 20% of SKUs by pick frequency or revenue, go closest to packing and shipping.
- B items, moderate movers, go in the next-closest zone.
- C items, slow movers, go furthest away.
Correct ABC slotting means fewer steps per pick. Demand shifts over time, though, so a static slotting plan slowly drifts out of date.
FIFO vs. LIFO
FIFO ships the oldest inventory first; LIFO ships the newest first. The choice determines which physical unit a picker grabs, not just how the books are kept.
FIFO is the default for anything perishable or date-coded, since it minimizes spoilage and dead stock. LIFO shows up more in non-perishable bulk goods like gravel, where unit age doesn’t matter. Applying LIFO to a perishable SKU is one of the most common, and most preventable, causes of dead stock.
Pallet Racking and Layout
Racking type controls the tradeoff between storage density and retrieval speed. Selective racking gives fast access but lower density; drive-in racking gives high density but slower access, since only the front pallet is reachable.
Layout optimization arranges racking, aisles, and pick paths to cut travel distance for the SKUs that move most, applying that same ABC logic to the physical floor plan.
The Formulas That Connect Storage Decisions to Distribution Action
These four calculations turn “we have inventory” into “we know exactly when to act.”
Reorder Point Formula
The reorder point is the exact inventory level that triggers a new order.
Reorder Point = (Average Daily Usage × Lead Time in Days) + Safety Stock
A product selling 50 units a day, with a 10-day lead time and 100 units of safety stock, has a reorder point of (50 × 10) + 100 = 600 units. At 600, a new order goes out.
Safety Stock Calculation
Safety stock is the buffer held against demand spikes or supplier delays.
Safety Stock = (Max Daily Usage × Max Lead Time) − (Average Daily Usage × Average Lead Time)
With max usage of 70 units over a 14-day max lead time, and average usage of 50 units over a 10-day average lead time: (70 × 14) − (50 × 10) = 480 units. Too little causes stockouts. Too much inflated carrying cost.
Economic Order Quantity (EOQ)
EOQ is the order size that minimizes combined ordering and holding cost.
EOQ = √[(2 × Annual Demand × Order Cost) ÷ Holding Cost per Unit]
At 10,000 units of annual demand, a $50 order cost, and $2 annual holding cost per unit: √[(2 × 10,000 × 50) ÷ 2] = √500,000 ≈ 707 units per order.
Inventory Turnover Ratio
Turnover measures how many times inventory sells and replenishes in a period.
Inventory Turnover = Cost of Goods Sold ÷ Average Inventory Value
A ratio of 8 means inventory fully turns over roughly eight times a year. Low turnover signals overstocking or weak sales velocity. Carrying cost, the price of holding that inventory, typically runs 20 to 30% of average inventory value annually according to APQC benchmarking data, which is why low turnover is expensive, not just inefficient.
Push vs. Pull Distribution
Push distribution moves inventory based on forecasted demand, before an order exists. Pull distribution moves inventory only after an actual order or signal triggers it. The two require almost opposite storage setups.
Push works best for predictable, staple demand, since the cost of a forecasting error stays contained. Pull works best for volatile or customized demand, since it avoids committing capital to inventory that might not sell.
| Push Distribution | Pull Distribution | |
| Trigger | Demand forecast | Actual order or signal |
| Storage need | Higher volume, less responsive | Lower volume, highly responsive |
| Risk | Overstock if forecast is wrong | Stockout if demand spikes fast |
| Best for | Predictable, staple demand | Volatile or customized demand |
Most real operations blend both: bulk safety stock pushed to a regional DC, with pick-and-pack fulfillment pulled from a forward location closer to the customer.
Distribution Network Models: Where You Store Inventory Changes How You Distribute It
Where a storage network sits is itself a distribution strategy, not a separate decision made afterward.
Centralized DC vs. Hub-and-Spoke
A centralized model holds nearly all inventory in one DC and ships outbound from that point. Hub-and-spoke routes inventory through smaller regional spokes before final delivery, trading storage efficiency for shorter last-mile distances.
Centralized storage is cheaper to run, one facility, one inventory pool, but it means longer last-mile distances. Hub-and-spoke costs more in facilities and duplicated inventory but cuts delivery time, which is why UPS and FedEx are both built this way.
Multi-Echelon Distribution
This is a network with more than two storage tiers, typically a central DC, regional DCs, and forward stocking points, where inventory flows down as it nears the customer. Each tier holds less inventory but needs to be reached faster.
The tradeoff is coordination complexity: more tiers means more inventory-visibility and reorder logic running at once.
Forward Stocking and Micro-Fulfillment Centers
A forward stocking location holds fast-moving inventory closer to customers to shorten last-mile time. A micro-fulfillment center does the same at a smaller, often automated scale, sometimes inside a retail store.
Both exist because last-mile delivery is the most expensive, time-sensitive leg of distribution, and storage placement is a lever transportation optimization alone can’t replace.
Decentralized Inventory Models
This model spreads stock across many smaller locations, regional warehouses, retail backrooms, 3PL nodes, instead of one or two large facilities. It buys proximity to demand at the cost of duplicated safety stock and reorder-point math run separately at every node. It’s the model behind most omnichannel fulfillment.
Cross-Docking vs. Storage
Cross-docking moves inbound goods directly to an outbound dock with minimal or no storage time. It compresses the five-step process above down to two steps: receiving and outbound.
Shipments are received, sorted by destination, and loaded onto outbound trailers, often within the same shift. There’s no put-away or pick step, which cuts labor and storage cost, but it only works when inbound and outbound volumes are tightly matched.
| Factor | Use Cross-Docking | Use Traditional Storage |
| Demand predictability | High, destination known in advance | Lower, needs a holding buffer |
| Product type | Fast-moving, non-seasonal, or perishable | Variable demand, longer shelf life |
| Facility requirement | Dock-heavy, minimal racking | Full racking and storage infrastructure |
| Best fit | Retail replenishment, grocery, parcel sortation | Wholesale, manufacturing inputs, safety stock |
Most networks use both: cross-docking SKUs with predictable, matched flow, and storing everything else.
The Systems That Sync Storage and Distribution in Real Time
Everything above depends on software that keeps storage and distribution looking at the same numbers at the same time.
WMS (Warehouse Management System): tracks inventory location, quantity, and movement. It’s the system of record for storage. Over 90% of warehouses are expected to use or plan to adopt one by 2027.
TMS (Transportation Management System): manages carrier selection, routing, freight cost, and tracking once goods leave the building. A WMS answers where inventory is; a TMS answers how it gets there and at what cost.
ERP integration: connects WMS data to finance, purchasing, and sales, so a reorder triggered on the floor reflects automatically in purchasing. Without it, someone has to manually carry numbers between systems, which is exactly where delays creep in.
RFID and barcode scanning: convert physical inventory movement into the digital record a WMS depends on, capturing the moment it happens instead of reconciling later.
IoT and automated storage/retrieval (AS/RS): IoT sensors track temperature and equipment status, critical for cold chain and bonded warehouse work. AS/RS uses robotics to store and retrieve inventory without a human picker.
Despite the attention automation gets, nearly 80% of warehouses globally remain non-automated as of 2026. For most businesses, the real fix needed is process and system integration, not robotics.
How to Know If Your Storage-Distribution Handoff Is Working
Track these metrics at the specific handoff points: receiving, the reorder trigger, picking, and outbound, not just at the facility level.
Order accuracy rate: the percentage of orders shipped with correct items, quantities, and destination. Calculated as (Total Orders − Orders with Errors) ÷ Total Orders × 100. Low accuracy almost always traces back to a storage-side problem that only becomes visible once it’s a shipping error.
OTIF (On Time, In Full): the percentage of orders delivered both on schedule and complete. Most retail and CPG companies treat 95% or higher as strong performance. Walmart enforces a 98% threshold for suppliers, with financial penalties for misses.
Inventory turnover and dwell time: turnover measures how efficiently stock moves through the full system. Dwell time measures the same kind of delay at a smaller scale, how long a truck or pallet sits idle. One industry analysis found drivers spend close to 119 minutes on average waiting at each stop, and an MIT study found roughly 40% of U.S. trucking capacity goes unused daily because of exactly this kind of waiting.
Shrinkage rate: the gap between recorded and actual inventory, as a percentage of sales. The most recent verified NRF benchmark puts average retail shrinkage at 1.6% of annual sales. Every unit lost to miscounting or theft is a unit that can’t ship when an order calls for it.
Logistics cost as a percentage of revenue: total storage and distribution cost as a share of revenue. Bain & Company’s research puts well-run CPG distribution and transportation costs at 6 to 8% of revenue, and notes that inefficient networks can often cut costs 10 to 25% through better systems alone, no added capacity required.
Storage and Distribution by Business Type
3PLs store inventory for multiple clients and bill by storage volume or pick-and-pack activity, turning a fixed cost into a variable one at the cost of less direct control over slotting decisions.
Bonded warehouses store imported goods under customs control before duties are paid. Goods can’t move to general distribution until cleared out of bond, which has to factor into lead-time calculations.
Cold chain logistics keeps a continuous temperature-controlled environment from storage through delivery. FIFO discipline is non-negotiable here, since expiration windows make LIFO operationally dangerous, not just suboptimal.
Omnichannel fulfillment uses one shared, reservable inventory pool across stores, e-commerce, and B2B channels, so a SKU ships from whichever location is fastest. It depends entirely on real-time inventory visibility; without it, orders get promised against stock already allocated elsewhere.
Common Failure Points Between Storage and Distribution
Most breakdowns happen at the seams, where a storage decision quietly becomes a distribution problem.
Dead stock and poor slotting: inventory that hasn’t moved and won’t sell at full value, usually from forecasting errors or LIFO applied to a perishable SKU. It ties up space and capital that should be funding inventory customers are actually ordering.
Inaccurate inventory counts: a perpetual system updates counts with every scan; a periodic system only updates at intervals, leaving a gap between the official count and reality. Cycle counting, rotating SKU counts on a regular schedule, catches discrepancies before they become a stockout.
Disconnected systems: the most common root cause of a broken handoff isn’t a process failure, it’s a software gap where the WMS, TMS, and ERP don’t share data automatically. A reorder point hit in the WMS that doesn’t flow into the ERP needs a human to notice and act, and that delay cascades through everything downstream.
Conclusion
Storage and distribution are one loop, not two departments. Goods get received, slotted, held until a calculated reorder point triggers action, then picked, packed, and shipped out, resetting the cycle again.
Get the formulas, network model, and systems right, and that loop runs on your own numbers instead of guesswork. Start by calculating real reorder points, connecting your WMS and TMS, and tracking one handoff metric long enough to see if it’s improving.
Ready to Optimize Your Distribution and Storage Operations in Ontario, CA?
We don’t just store your inventory. We run the full loop. From calculated reorder points and ABC-slotted warehousing to last-mile delivery across Southern California, our Ontario facility is built to keep your supply chain moving without the gaps. Whether you need 3PL storage, cross-docking, or a fully integrated fulfillment setup, we have the systems, space, and expertise to make it work. Stop letting storage and distribution run as two separate departments. Contact Logos Logistics Distribution today and let us build a setup that works on your numbers, not guesswork.
Frequently Asked Questions
Is storage part of distribution, or are they separate functions?
They’re sequential and connected, not separate. Storage holds inventory and prepares it for movement; distribution executes that movement once a trigger calls for it.
What’s the difference between a warehouse and a distribution center?
A warehouse is built for holding inventory longer with fewer order-processing functions. A distribution center is built for fast inbound-to-outbound flow, including order fulfillment and shipping.
What triggers the move from storage to distribution?
Usually hitting the reorder point, the calculated inventory level where distribution action has to begin. Other triggers include a direct customer order or a scheduled push shipment.
How do you calculate when to reorder stock?
Reorder point = (average daily usage × lead time in days) + safety stock. Selling 50 units a day with a 10-day lead time and 100 units of safety stock gives a reorder point of 600 units.
What’s the difference between push and pull distribution?
Push moves inventory based on forecasted demand before an order exists. Pull moves inventory only after an actual order triggers it.
Do small businesses need separate storage and distribution facilities?
No. Most run both out of one facility. What matters is whether layout, slotting, and systems actually connect the two functions, not physical separation.
How does cross-docking change the relationship between storage and distribution?
It compresses storage to almost zero, moving goods from inbound to outbound within hours instead of days. It only works when inbound and outbound volumes are tightly matched.